The Cost of Leverage: Why Your "High Yield" Strategy Might Be Losing Money
Stop chasing APR. Start calculating your Friction Costs. In the world of Recursive Borrowing, time is your only protection against fees.
We have all seen the tempting yields on platforms like Aave, Kamino, or Euler. By recursively supplying and borrowing the same asset (Looping), you can amplify your 5% yield into 12%, 15%, or even 20%.
It looks like "free money" on paper. But there is a hidden killer that most dashboards don't show you: Friction.
Today, we are diving into our latest tool at Qalc.ai: The Recursive Borrowing Simulator. We’re going to look at why a strategy that promises $100/month in profit might actually keep you in the red for the first 33 days.
What is Recursive Borrowing (Looping)?
Recursive borrowing is a strategy where you:
- Deposit an asset (e.g., JLP or SOL) as collateral.
- Borrow a stablecoin against it.
- Swap that stablecoin for more of the original asset.
- Redeposit it and repeat.
Each "loop" increases your exposure and your yield. But each loop also costs you money in Swap Fees, Slippage, and Gas.
The $10,000 Looping Audit: A Real-World Case Study
Let’s plug a common scenario into the Qalc.ai Simulator:
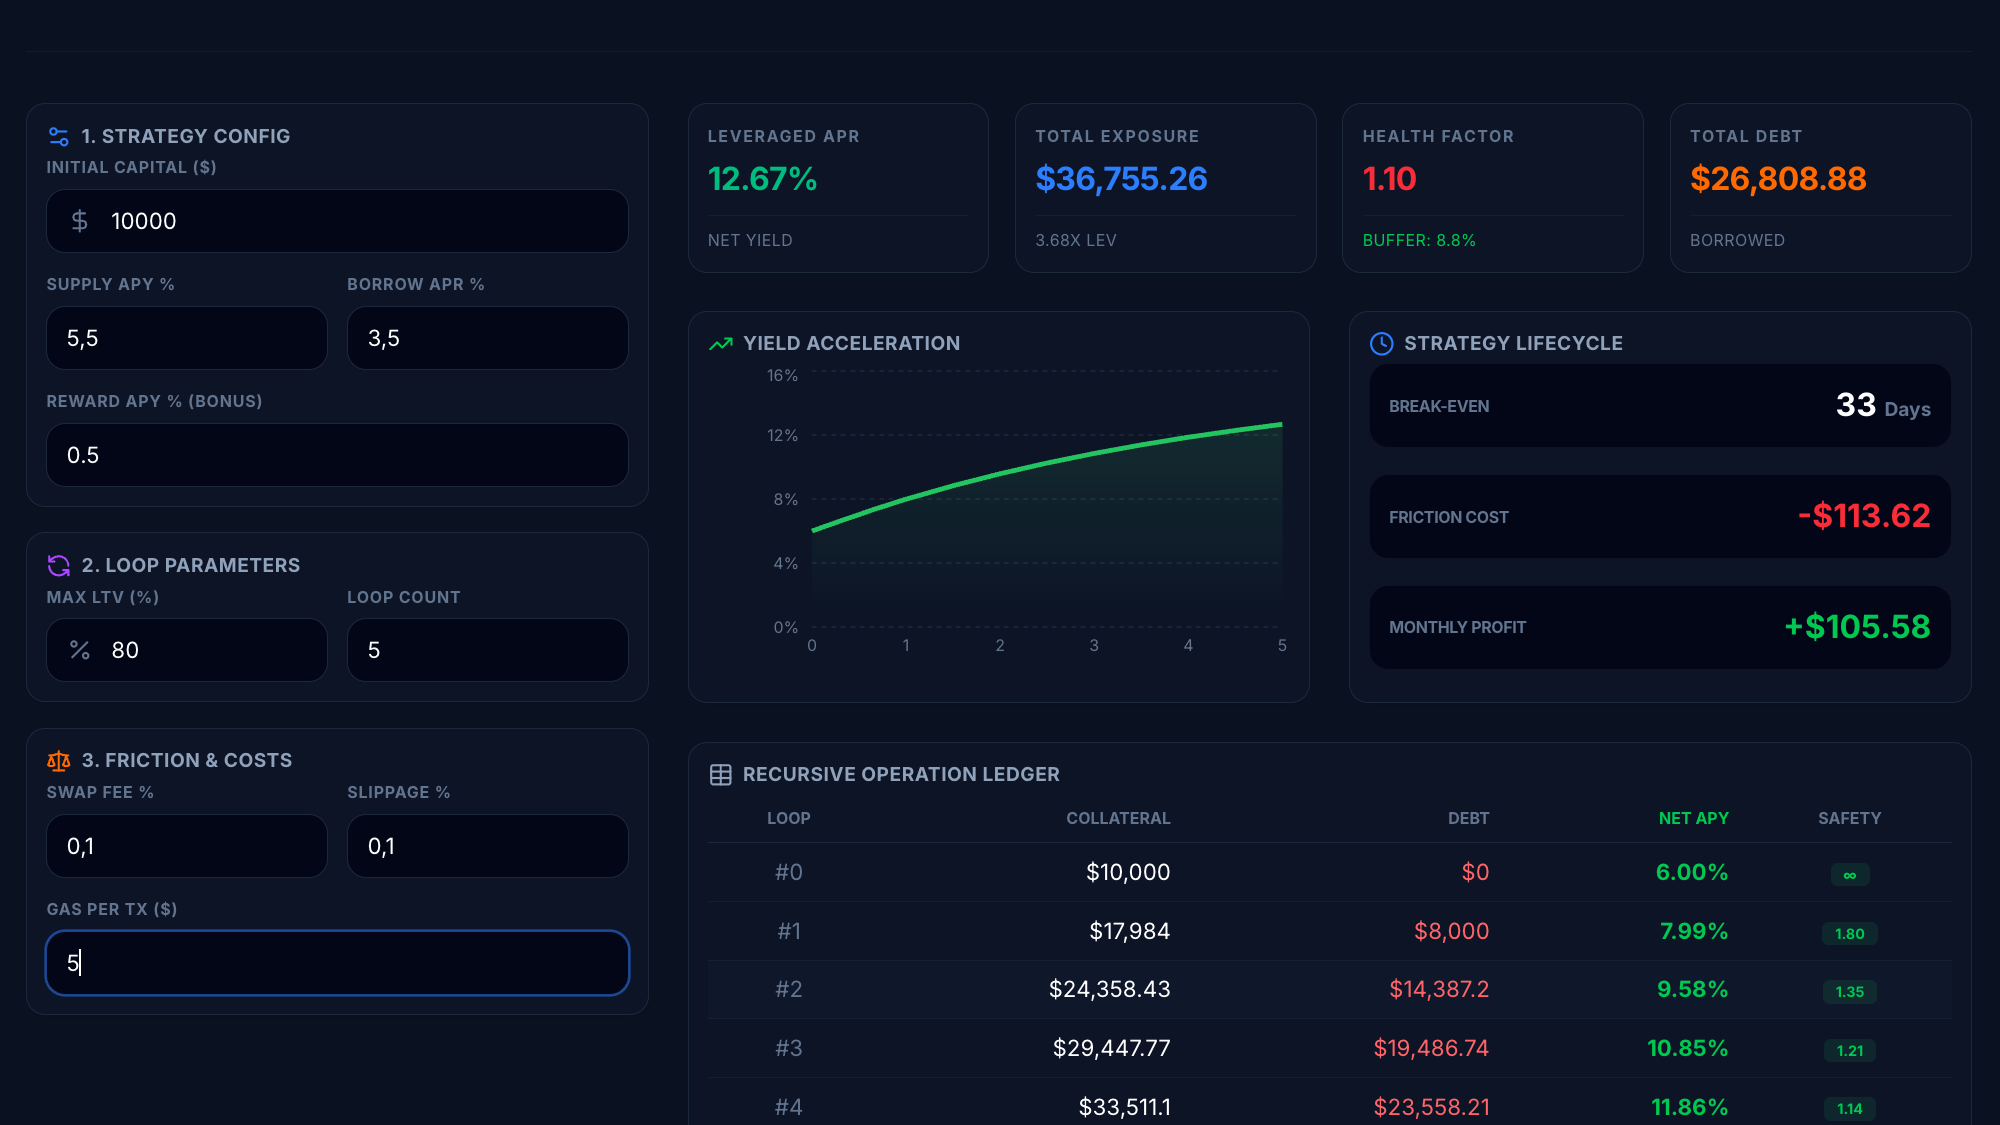
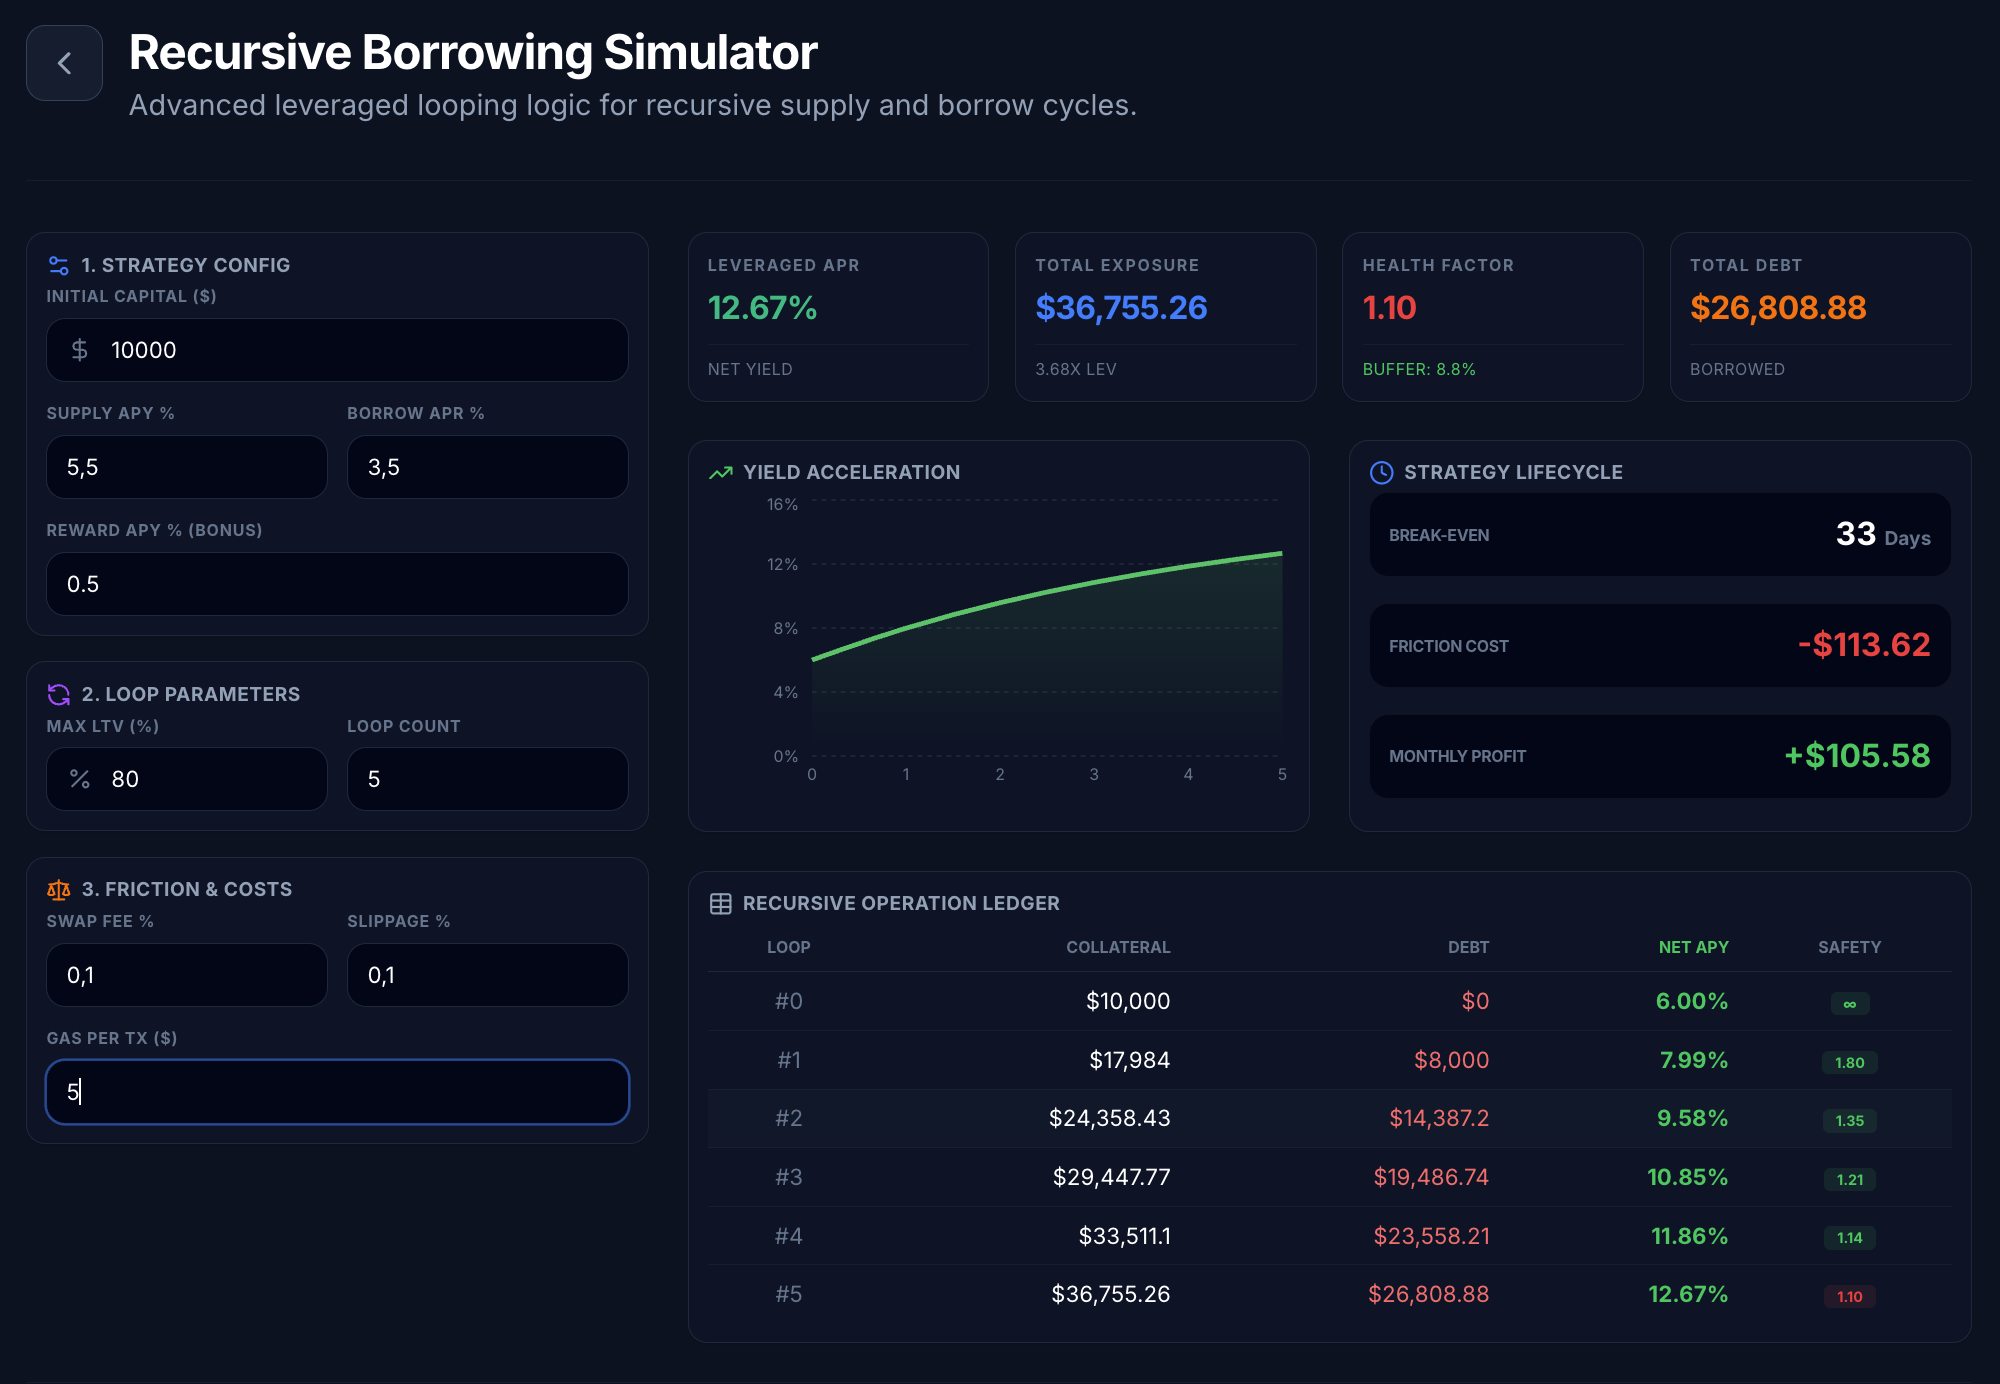
- Initial Capital: $10,000.
- Strategy: 5 recursive loops with an 80% LTV.
- Supply APY: 5.5% + 0.5% bonus.
- Borrow APR: 3.5%.
At first glance, the Leveraged APR is 12.67%. Your total exposure has grown to $36,755 (3.68x leverage). You expect to start making money immediately.
But look at the "Friction & Costs" section:
- Swap Fee: 0.1%
- Slippage: 0.1%
- Gas per TX: $5
The Invisible Debt: Understanding "Friction Cost"
Every time you perform a loop, you lose a small percentage of your capital to the ecosystem. In our simulation, performing 5 loops cost us exactly $113.62.
This is what we call Friction Cost. Before you earn a single cent of profit, you are starting with a balance of -$113.62.
The Break-Even Trap
Most investors open a leveraged position and close it 3 days later because they see a slight price move. If you did that in this scenario, you would lose money, even if the price stayed perfectly stable.
According to our Strategy Lifecycle metrics:
- Monthly Profit: +$105.58
- Break-Even Time: 33 Days
The Reality Check: You need to stay in this strategy for over a month just to pay off the cost of entering it. If you plan to "trade" these yields weekly, you are simply donating your capital to liquidity providers and miners.
Health Factor: The Line Between Profit and Liquidation
Leverage isn't just about fees; it's about survival. Our simulator tracks the Health Factor across every loop in the Recursive Operation Ledger.
In this setup, our final Health Factor is 1.10.
- Buffer: Only 8.8%.
- Risk: A small 9% drop in your collateral value would trigger a liquidation, wiping out your $10,000.
By using the Yield Acceleration graph, you can see how your APY climbs with each loop, but you can also see your Safety margin (Health Factor) drop into the "Red Zone" (1.10).
[Image: Recursive Operation Ledger in Qalc.ai]
How to Use This Tool to Protect Your Capital
Before you open your next leveraged position on any DeFi protocol, ask yourself these three questions using Qalc.ai:
- What is my actual Friction Cost? (Is it $10 or $113?)
- What is my Break-Even point? (Am I willing to hold this for 33 days?)
- What is my Liquidation Buffer? (Can I survive a 10% market correction?)
Conclusion: Math > Hype
DeFi protocols want you to see the 12% APR. We want you to see the 33-day break-even period and the 1.10 Health Factor. When you trade with the full picture, you stop being a "yield chaser" and start being a professional manager of your own capital.
Stress-test your recursive strategies now: qalc.ai/defi/leveraged-yield-loop