The "Mid-Flight" Check: How to Audit Your Active Uniswap v3 Positions with Qalc.ai
Every liquidity provider knows the feeling: you’ve been in a Uniswap v3 pool for a week, you see some fees accumulating in your dashboard, but the token prices have moved. You find yourself asking, "Am I actually making money, or is Impermanent Loss eating my lunch?"
While most calculators only show you "what if" scenarios for the future, the qalc.ai Uniswap v3 Simulator allows you to perform a Mid-Flight Audit. By plugging in your real-time collected fees and shifting the current price, you can see exactly where you stand. Today, I’ll show you how I use this to decide whether to stay in a pool or pull my liquidity.
The Setup: Auditing a $10,000 Position
Let’s say I opened a position in the JLP/USDC pool. Here are my original entry stats:
- Entry Price: $4.09 per JLP.
- Investment: $10,000.
- Price Range: $3.50 to $4.40.
I’ve been in the pool for about 10 days, and I’ve collected exactly $200 in fees. Now, the market has moved, and I need to know my true Net PNL.
Scenario 1: The "Price Drop" Stress Test
The price of JLP has dipped from my entry of $4.09 down to **$3.90**.
In a standard dashboard, I might just see "+$200 Fees" and feel happy. But look at the math in the simulator:
- Fees Earned: $200.
- Impermanent Loss: -0.51% (vs. simply holding).
- Net PNL: -$0.24.
The Realization: Despite having $200 in my pocket from fees, the drop in the value of JLP has almost perfectly cancelled out my gains. I am essentially at a "break-even" point. The calculator tells me I need 7 more days of fees at current rates just to recover from the divergence loss.

Scenario 2: The "Partial Recovery" Analysis
Now, let’s imagine the price recovers slightly from $3.90 up to **$4.00**. It’s still below my entry price of $4.09, but the gap is closing.
I set the Sim Price to 4.0 in the qalc.ai tool:
- Fees Earned: $200 (remains the same).
- Impermanent Loss: Shrinks to -0.11%.
- Net PNL: +$117.72.
The Decision: Now the picture changes. Even though JLP is still cheaper than when I bought it, my "Fee Engine" has officially overtaken the price drop. I am now in a healthy profit. The simulator shows my Days to B.E. (Break Even) is down to just 2 days. This gives me the confidence to keep the position open.

Scenario 3: Using "0 Days" to Predict Your Reaction
One of my favorite "hacks" with this tool is setting the Days in Pool to 0 while keeping Collected Fees at $200.
By doing this, I treat the $200 as a "fixed shield." I can move the price slider left and right to see exactly at what price point my $200 in fees fails to protect me.
- If JLP hits $3.80, does my $200 cover it?
- If JLP hits $4.30, how much extra profit do I make from the price rise?
This isn't just a calculator; it’s a Decision Matrix. I can prepare my "Exit Plan" before the market even moves.
Why This Matters for Your Portfolio
Uniswap v3 is a game of "Fees vs. Range." Most people fail because they don't account for the value of their tokens changing while they earn interest.
With qalc.ai, you can:
- Stop Guessing: Know your exact Net PNL including fees and price shifts.
- Calculate Efficiency: See your Capital Multiplier (in these examples, we are at 18.0x efficiency).
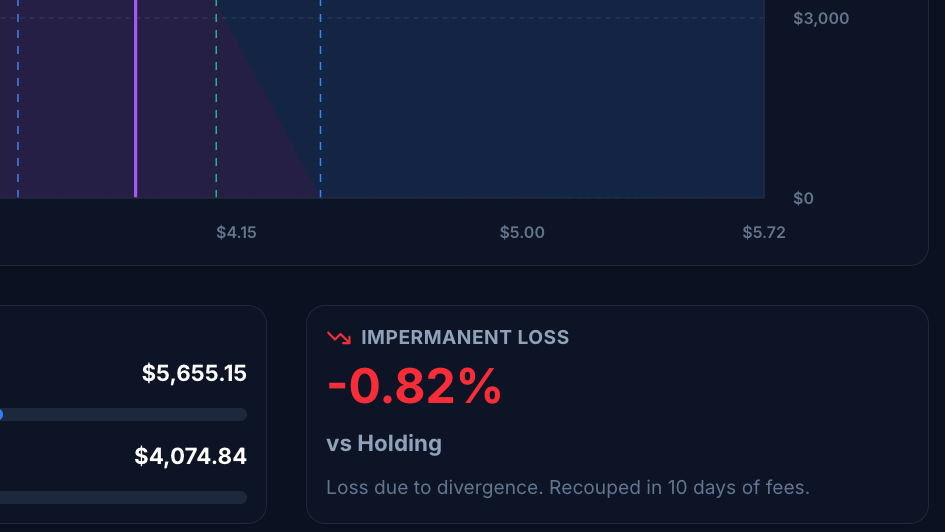
- Visualise the Curve: See exactly where you sit on the liquidity curve (the purple line) and how close you are to your "Min" or "Max" price boundaries.
Conclusion
Don't wait for your monthly statement to see if your DeFi strategy is working. Take 30 seconds to plug your current fees and token price into the qalc.ai Uniswap v3 Calculator.
Are you currently in profit or just "feeling" like you are?
Check your position now: https://qalc.ai/defi/uniswap-v3-simulator